
The State of Nature 20191 report has recently been published by a partnership consisting of more than 50 organisations drawn from conservation NGOs, research institutes and UK and national governments working together to provide an up to date assessment of the state of the UK’s wildlife across land and sea.
Key findings from the report include:-
- A 13% decline in average species’ abundance since 1970, based on 696 terrestrial and freshwater species. Since 1970, 41% of species have shown strong or moderate decreases, whereas 26% have shown strong or moderate increases.
- A 5% decrease in species’ distribution since 1970, based on 6,654 species from a range of taxonomic groups. Since 1970, 27% of species have shown strong or moderate decreases, whereas 21% have shown strong or moderate increases.
- Of 8,431 terrestrial and freshwater species that have been assessed using IUCN Red List Criteria, 1,188 (15%) are categorised as being at risk of extinction from Great Britain.
- The proportion of species undergoing rapid changes; the proportion of species defined as showing strong changes in abundance, either increases or decreases, rose from 33% over the long term to 53% over the past 10 years.
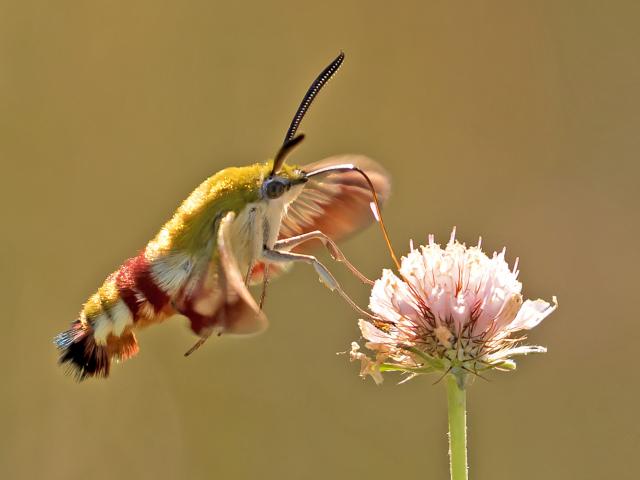
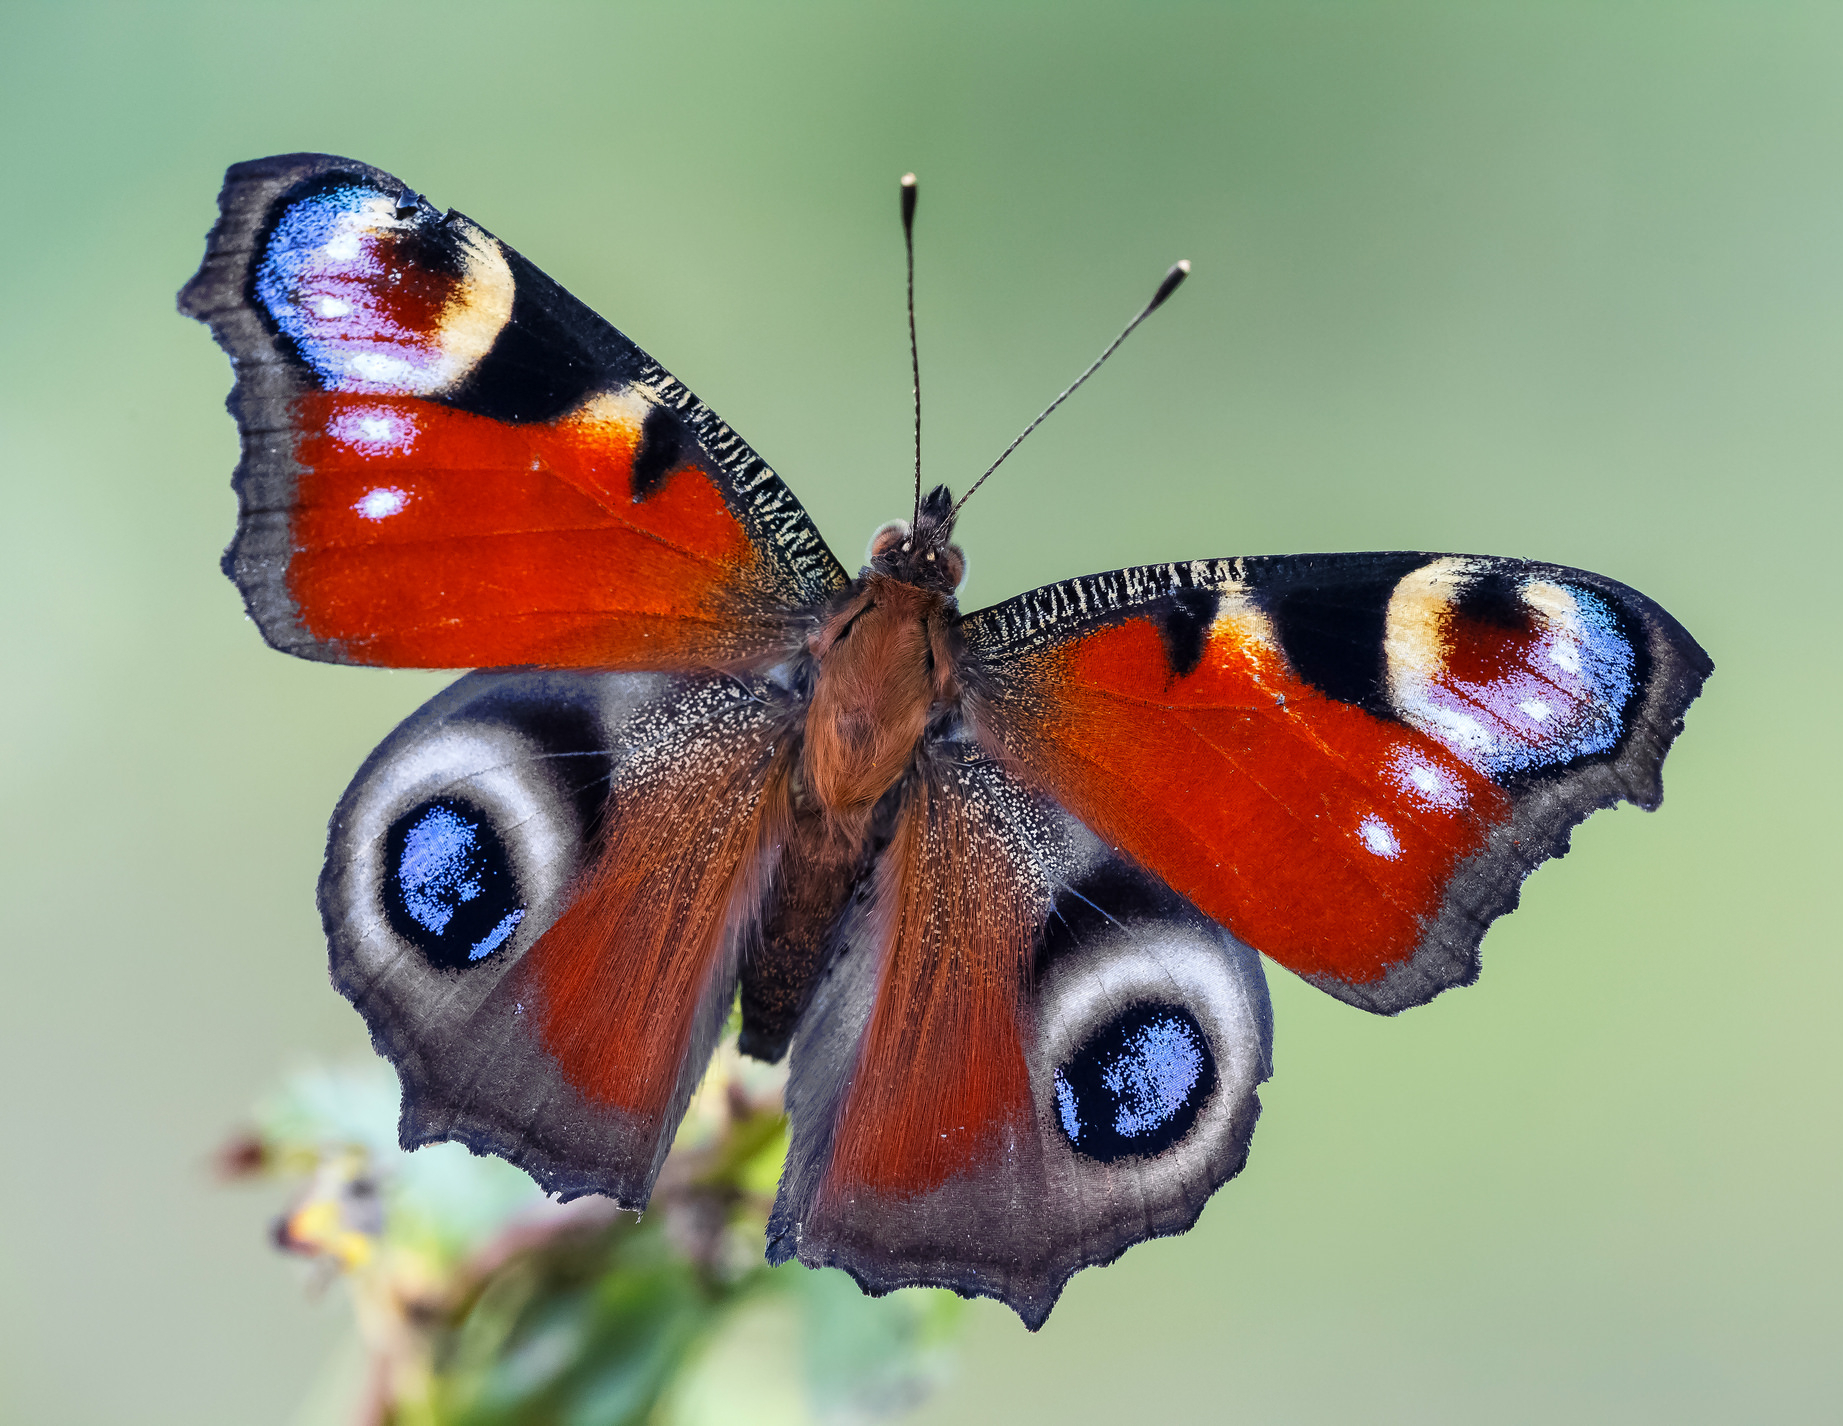
Abundance data was compiled for 57 butterfly species from the UK Butterfly Monitoring Scheme, and for 442 moth species from the Rothamsted Insect Survey and Butterfly Conservation’s rare moth monitoring projects.
The State of Nature report brings together datasets on multiple terrestrial and freshwater species to provide an overview of changes in UK biodiversity. These datasets are typically time-series that have been estimated from statistical models, rather than raw counts or observations. In the case of butterflies and moths2, indices of abundance are produced using the Generalised Abundance Index (GAI) approach3. The method accounts for missing weeks in the data by modelling species’ flight periods, in order to produce summaries of species’ population changes in the form of indices and trends.
The latest report confirmed long-term decreases in average abundance in butterflies (16%) and moths (25%). As well as presenting trends in species’ status, the report also highlights various pressures acting upon terrestrial and freshwater wildlife. These include agricultural management, climate change, hydrological change, urbanisation, pollution, woodland management, and invasive non-native species. Butterfly and moth data contributed to assessing the state of biodiversity in relation to some of the above drivers of change, for example showing the decline in the UK woodland butterfly indicator. Butterfly indicators for England, Scotland, Wales and Northern Ireland, and an indicator for moths in Scotland, all contributed to the UK country-level assessments in the report.
Due to numerous pressures populations of many species in the UK, including many butterflies and moths, continue to show worrying declines. However, the State of Nature 2019 report showcases a range of conservation initiatives demonstrating positive results for the UK’s nature. Through suitable management, some conservation successes of our most threatened species, such as Duke of Burgundy and Large Blue, show that conservation action and research can help save species from further decline.
References
1 Hayhow, D.B., Eaton, M.A., Stanbury, A.J., Burns, F., Kirby, W.B., Bailey, N., Beckmann, B., Bedford, J., Boersch-supan, P., Coomber, F., Dennis, E., Dolman, S., Dunn, E., Hall, J., Harrower, C., Hatfield, J., Hawley, J., Haysom, K., Hughes, J., Johns, D., Mathews, F., McQuatters-Gollop, A. Noble, D., O’Brien, D., Outhwaite, C., Parry, M., Pearce-Higgins, J., Prescott, O., Powney, G., Symes, N., Weighell, T. and Williams, J. (2019) The State of Nature 2019. The State of Nature partnership.
2 Harrower, CA, et al (2019). UK moth trends from Rothamsted Insect Survey light trap network (1968 to 2016). NERC Environmental Information Data Centre. https://doi.org/10.5285/e7e0e4ad-f8c1-46fc-85b5-6d88057024b8.
3 Dennis, EB, et al. (2016). A generalized abundance index for seasonal invertebrates. Biometrics, 72: 1305-1314.