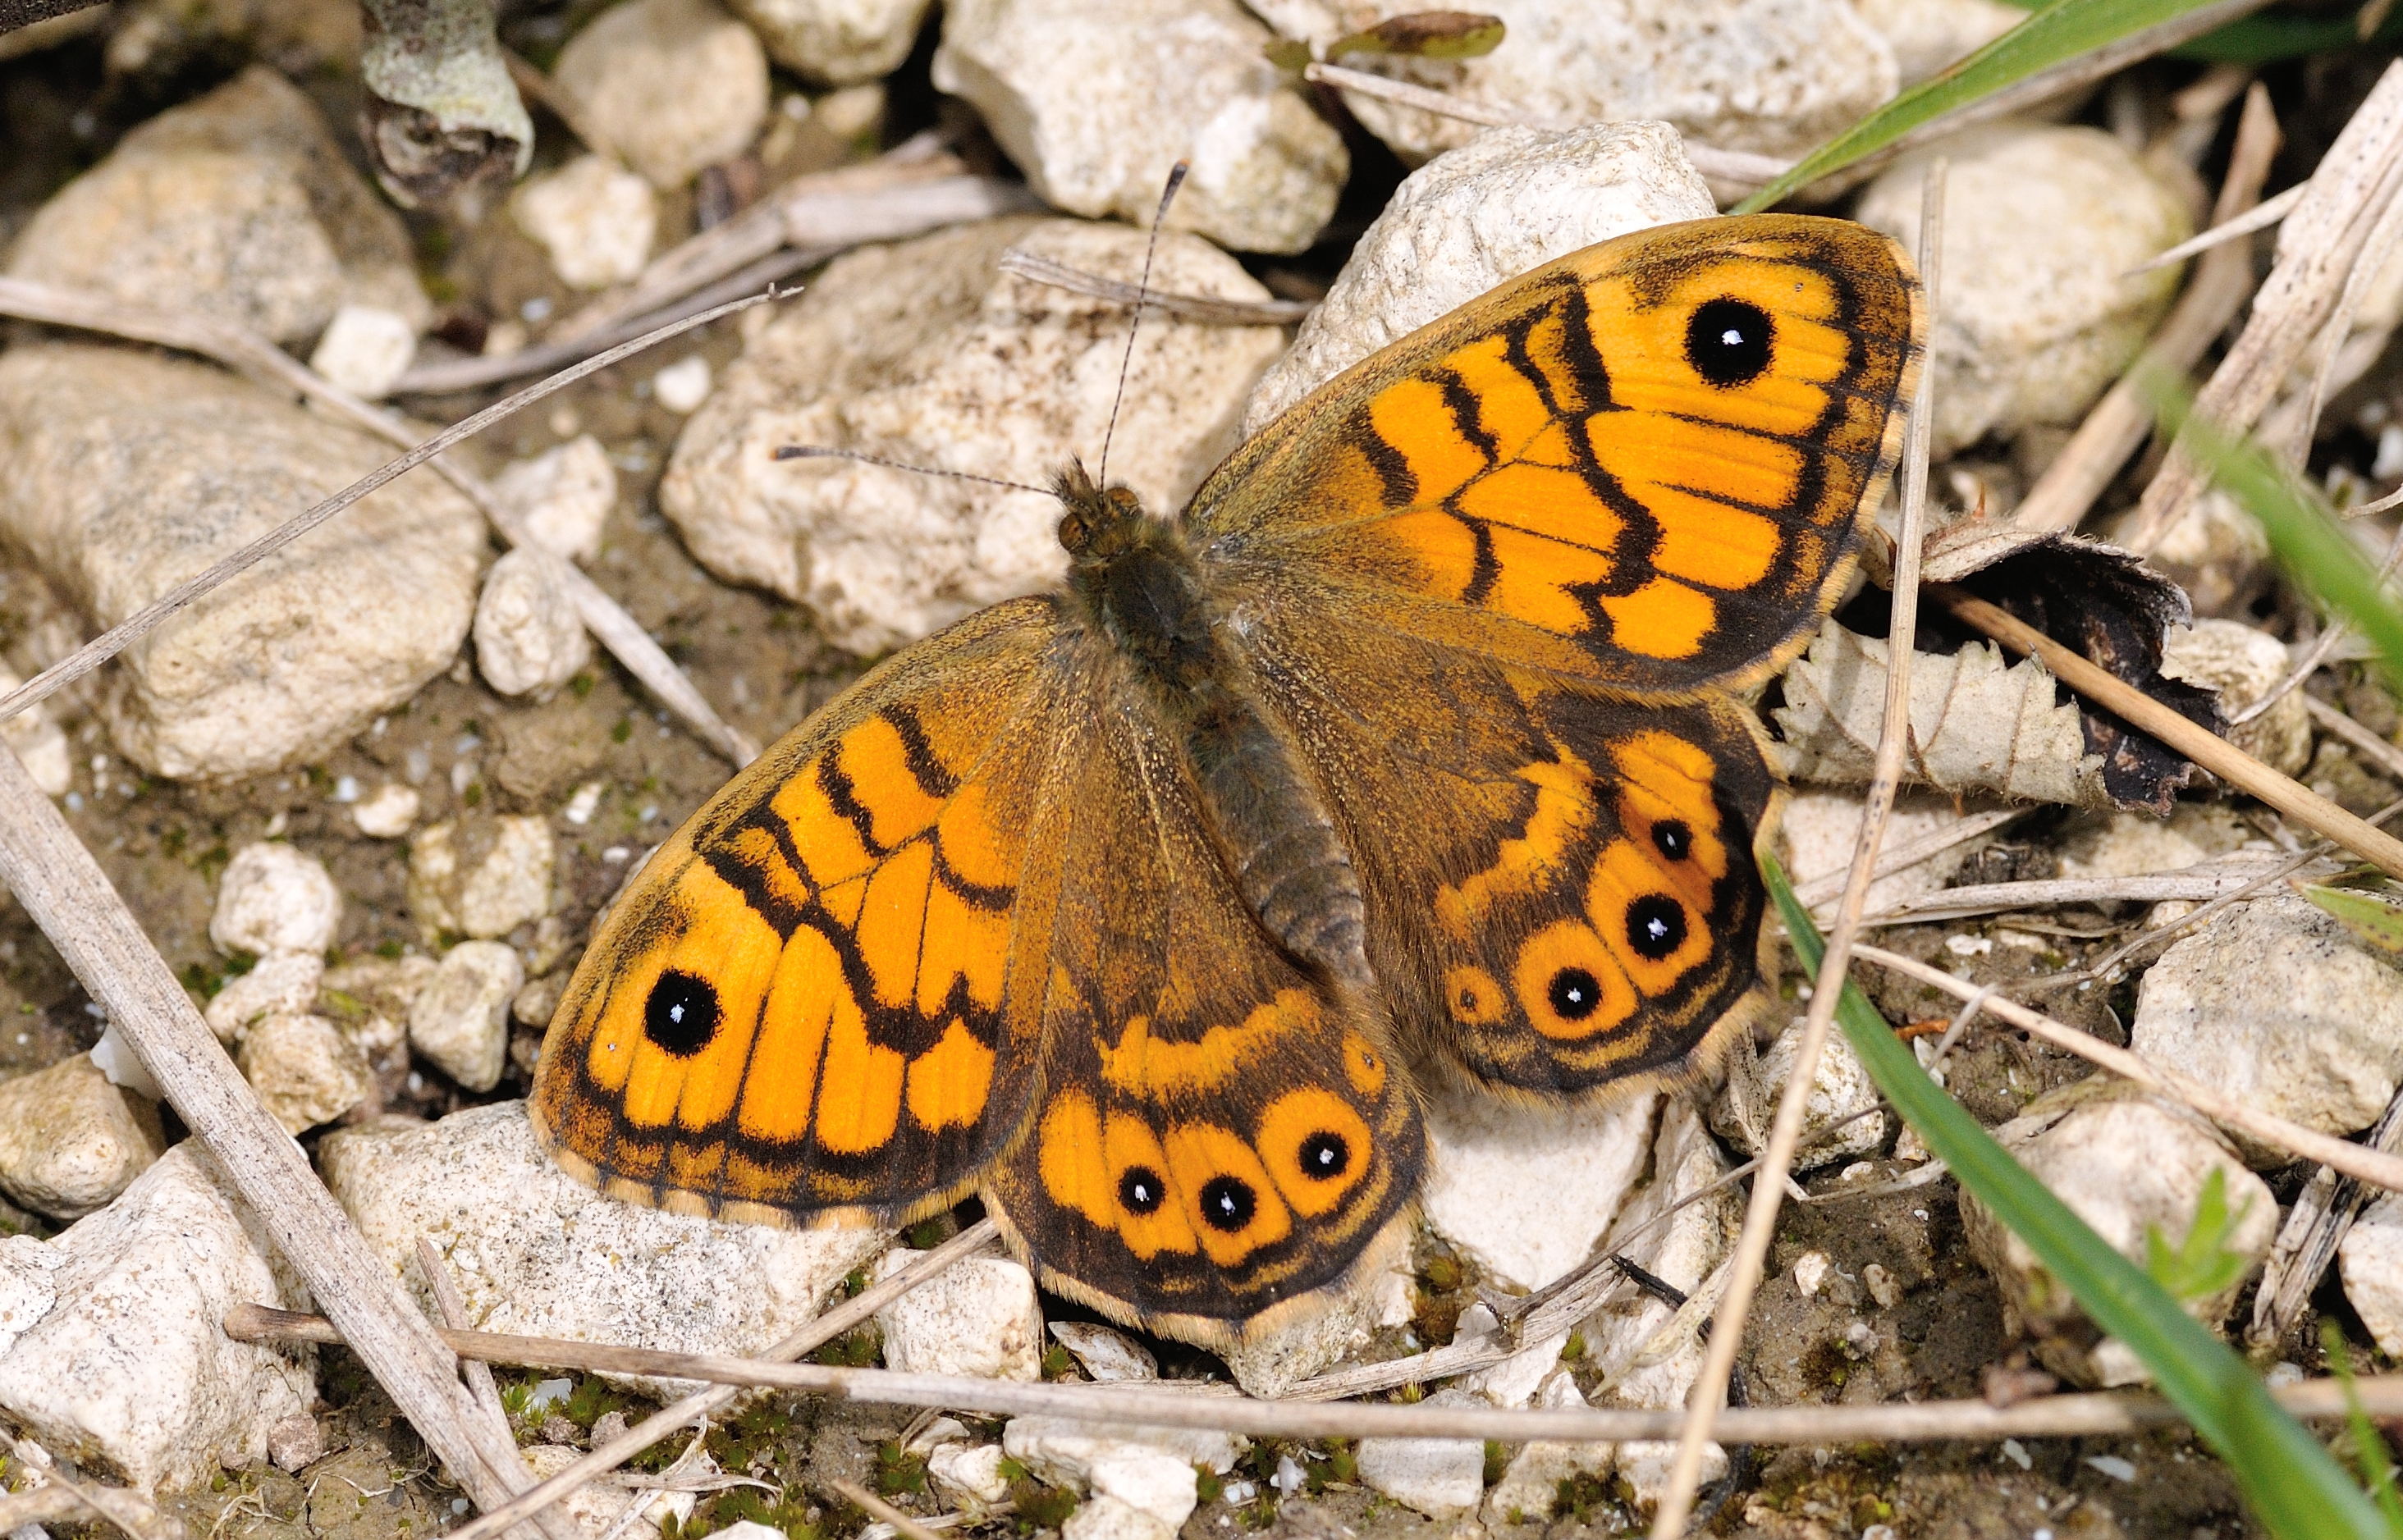
Wall - Bob Eade

Wall - Bob Eade
A new study, led by the University of Northumbria and involving Butterfly Conservation, has carried out the first nationwide assessment of the combined impacts of long-term land-use and climatic change on species distributions. Lead researcher, Dr Andy Suggitt, explains how a new map of land-use change for Great Britain helped improve our understanding of how species respond to multiple threats.
Like most wildlife, butterflies and moths are known to be facing of myriad of threats from human activity1,2. Where two or more of these are in play at the same place and the same time, the outcome for populations is often thought to be worse, as the multiple threats may interact and drive stronger declines than the simple sum total of their individual effects. This makes intuitive sense: the population might be able to resist one adverse effect relatively unscathed, bouncing back, but two at once may overwhelm the population’s capacity to recover, making local extinction far more likely.
Despite it making intuitive sense, the idea that two adverse effects could interact in this way hasn’t actually been tested a great deal. This is because the data required to perform the analyses are rarely available at a fine-grained level over broad spatial extents, and going back far enough in time to capture what has been (in the UK at least) quite the legacy of habitat change. That said, a growing literature3,4 has made use of repeat surveys at sites where the management history is known.
We need to know how population-level changes translate into broader-scale changes in species’ distributions, which are documented by Butterfly Conservation’s recording schemes and army of volunteer recorders. To analyse these changes at such wide spatial extents, and over such a long period of time, requires complementary datasets that can quantify possible threats at the same level of spatial precision and that extend as far back in time.
Unfortunately, when it comes to land-use change, datasets that quantify the massive changes to the landscapes of the UK through the 20th century are rare, especially when you consider that many of these changes took place prior to the advent of satellite-based remote sensing5. Whilst the Met Office continue to improve the availability of weather and climate data back to the 19th century and beyond at impressive spatial precision6, similar datasets that quantify the substantial habitat changes (and losses) of the 20th century do not cover the whole country.
It was this issue with the lack of historical data on habitat change that got myself and my collaborator Alistair Auffret interested in seeing if we could generate such a dataset from the maps collected for the Dudley Stamp Land Utilisation Survey of Great Britain7 that took place in the 1930s/40s. These maps are the product of a huge national effort, one county at a time, to map the nation’s land use- sometimes down to the level of identifying which crops were grown in individual fields. Together with a team of researchers at the University of Portsmouth, we were able to digitise and georeference all 169 map sheets8 generated by the survey team, and comparing these to modern-day satellite equivalents from the Centre of Ecology and Hydrology9, we compiled a first map of land-use change for Great Britain10.
Using this new map of land use change, our new study estimated that some 90% of the semi-natural lowland meadows and pasture in Britain was lost over the 75 years or so since the Dudley Stamp surveys in the 1930s/40s. The map also provided a first opportunity to examine the extent to which land-use change had played a role in national-scale distribution declines in Britain- and crucially, if or how land-use change effects were interacting with climate change to worsen the prognoses for species. But in order to do this, we first needed a more generalised measure of ‘land conversion’ that we could use in analyses for all species, so we calculated the proportion of each hectad (10km x 10km grid square) that had changed from one broad type to another e.g. from semi-natural grassland to arable. Then, using over 20 million distribution records supplied by Butterfly Conservation, the Botanical Society of Britain and Ireland and British Trust for Ornithology, we fitted statistical models to the spatial patterns of range retraction for 1,192 species of butterflies, macro-moths, plants and birds, with climate change and land conversion fitted as possible explanatory variables.
The results, published in the journal Nature Communications, were somewhat surprising; that interaction effects between climate change and land conversion on species distribution change were relatively rare, affecting roughly 1 in 5 species, but that any effect of the interaction itself on the extinction risk of populations was often weak. Often, the net effect of our two predictors was very close to, or equal to the simple addition of each predictor on its own. Whilst we found that a number of species benefitted from climate change, with extinction risk decreasing by a median of 13.7% for every 0.1°C per decade of warming, a more typical pattern of winners and losers from land conversion was in evidence. This showed a weakly positive effect of land conversion acting on a larger cohort of species, and a strongly negative effect acting on a smaller cohort of habitat specialists.
Focussing on butterflies specifically, we identified negative effects of either land-use change or climate change for five of the top 10 species with the fastest distribution declines reported in the State of UK’s Butterflies 20221 (due to our inclusion criteria we only analysed seven of the top 10). Our analyses suggest negative effects of warming climate on Pearl-bordered Fritillary (Vulnerable as per GB Red List11), High Brown Fritillary (GB Endangered), and Wall (GB Endangered). The case of the Wall proved particularly interesting as we identified an interaction effect between climate warming and land-use change; our models determining that local extinctions have been most likely where rates of change in both factors have been the highest. Could this interaction be behind the ‘hollowing out’ of the distribution of this species over the last few decades?
Looking across all the Red List butterflies11 that we analysed in our study (n = 17), our models suggest that either climate warming or land conversion (or both), have driven the decline of 10 species. While it reiterates the importance of these human influences on our wildlife, the study is also a reminder of how much work is left to do to identify and understand the growing number of threats that Lepidoptera face across the UK.
References
1. Fox R, Dennis EB, Purdy KM, Middlebrook I, Roy DB, Noble DG, Botham MS & Bourn NAD. 2023. The State of the UK’s Butterflies 2022. Butterfly Conservation, Wareham, UK.
2. Fox R, Dennis EB, Harrower CA, Blumgart D, Bell JR, Cook P, Davis AM, Evans-Hill LJ, Haynes F, Hill D, Isaac NJB, Parsons MS, Pocock MJO, Prescott T, Randle Z, Shortall CR, Tordoff GM, Tuson D & Bourn NAD. 2021. The State of Britain’s Larger Moths 2021. Butterfly Conservation, Rothamsted Research and UK Centre for Ecology & Hydrology, Wareham, Dorset, UK.
3. Outhwaite CL, McCann P & Newbold T. 2023. Agriculture and climate change are reshaping insect biodiversity worldwide. Nature 605, 97–102.
4. Newbold T, Oppenheimer P, Etard A, Williams, JJ. 2020. Tropical and Mediterranean biodiversity is disproportionately sensitive to land-use and climate change. Nat Ecol Evol 4, 1630–1638.
5. Stamp LD. 1955. Man and the Land. Collins New Naturalist #31. Collins, London, UK.
6. Hollis D, McCarthy M, Kendon M, Legg T, Simpson I. 2018. HadUK-Grid gridded and regional average climate observations for the UK. Centre for Environmental Data Analysis. http://catalogue.ceda.ac.uk/uuid/4dc8450d889a491ebb20e724debe2dfb
7. Stamp DL 1931. The land utilisation survey of Britain. Geogr. J. 78, 40–47.
8. National Library of Scotland, 2023. Land Utilisation Survey of Great Britain, 1931-1938. https://maps.nls.uk/series/land-utilisation-survey/info.html
9. Morton D, Rowland C, Wood C, Meek L, Marston C, Smith G, Wadsworth R & Simpson I. Final Report for LCM2007 – the new UK Land Cover Map. July 2011. Centre for Ecology & Hydrology, Wallingford, UK.
10. Suggitt AJ, Wheatley CJ, Aucott P, Beale CM, Fox R, Hill JK, Isaac NJB, Martay B, Southall H, Thomas CD, Walker KJ & Auffret AG. 2023. Linking climate warming and land conversion to species’ range changes across Great Britain. Nature Communications 14, 6759.
11. Fox R, Dennis EB, Brown AF & Curson J. 2022. A revised Red List of British butterflies. Insect Conservation and Diversity 15, 485-495.