

This article describes the hibernation behaviour of Small Tortoiseshell and Peacock butterflies in my St Albans shed during 2019. It provides an update on an article first published in an abridged form in Butterfly Conservation – Herts & Middx Branch Newsletter in April 2019. The full version of the article is available on the Herts & Middx BC Branch website.
2019 Observations
Overall Numbers – a bumper year
2019 has been a bumper year for both Small Tortoiseshell and Peacock numbers. The total number of the two species of butterflies hibernating in my shed through the winter of 2019/20 is 43. This is the highest since recording began in 1995. The total of Peacocks (13) is more than double the previous best year and Small Tortoiseshells (30) are having their second-best year during that period.
Across the UK, numbers of the two species recorded in flight on Butterfly Conservations Big Butterfly Count both increased considerably. Small Tortoiseshell was up 167% and Peacock up 235% on last year. Both species also recorded their highest absolute number of records since the Count commenced in its current form in 2010.
Emergence
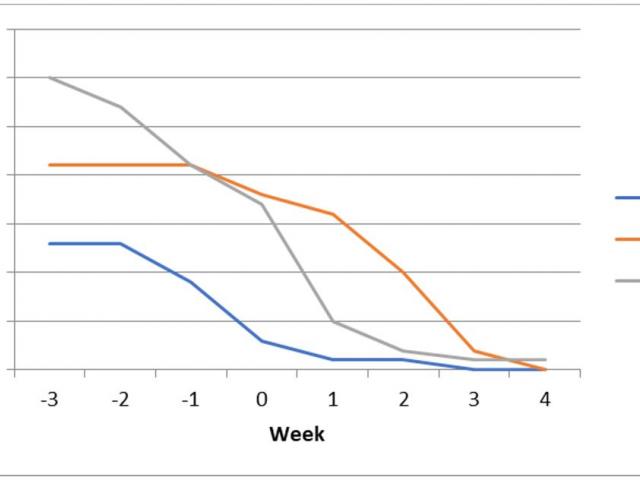
The emergence of Small Tortoiseshells from hibernation in the Spring of 2019 was noticeably earlier than the previous two years with 90% on the wing before the end of March (Week 0)
The period of Peacock emergence was from 22nd March – 22nd April
Entering Hibernation
• In 2017 all Small Tortoiseshells began hibernation in late June and were all in for the winter by 7th July, with no more after that date.
• In 2018 Small Tortoiseshell hibernation started later on 11th July and virtually complete by 5th August.
• In 2019, the first wave of Small Tortoiseshell hibernation started on 12th July and lasted until the end of the month.
• In 2019 there was a second period of hibernation, with more Small Tortoiseshells entering hibernation at a slow rate, numbers rising gradually from 23 in mid-August to 30 by the start of October.
• This “two-phase” pattern of hibernation – a first period being a sudden rush, followed by a slow trickle in a longer second period matches my observations from 2016
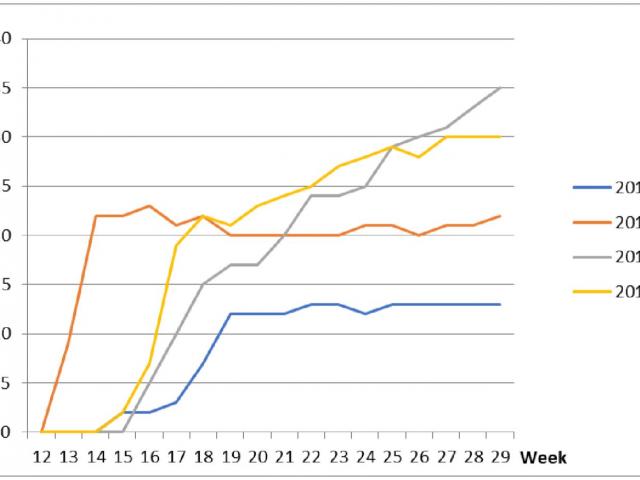
A summary showing the full extent of the variation is shown below. I have calculated the percentage of hibernating Small Tortoiseshells in hibernation by early August (week19). This date was chosen as it is the latest that the first period rush has completed.
| Winter (Year) | Maximum Number |
Entry Period (Earliest) |
Entry Period (Latest) | % hibernating by 1st week of Aug | Emergence Period (Earliest) | Emergence Period (Latest) |
| 2019/20 | 30 | 12 Jul | 4 Oct | 73% | - | - |
| 2018/19 | 13 | 11 Jul | 5 Aug | 92% | 22 Mar | 13 Apr |
| 2017/8 | 23 | 30 Jun | 07 Jul | 100% | 30 Mar | 20 Apr |
| 2016/7 | 35 | 23 Jul | 14 Oct | 49% | 05 Feb | 02 Apr |
| 2015/6 | 17 | 08 Aug | 24 Oct | 49% | 20 Feb | 01 May |
| 2014/5 | 14 | 19 Jul | 29 Sep | 80& | 06 Apr | 12 Apr |
| 2013/4 | 28 | 18 Jul | 25 Aug | 58% | n/a | 26 Apr |
The variation is quite stark – in 2015 and 2016 only half the hibernating population entered in the first rush. In 2017 and 2018 virtually all Small Tortoiseshells hibernated in that early period. 2019 is in-between with 73% of hibernators entering in the first rush – most similar to the pattern in 2014.
Peacocks entering hibernation
For the first time, there have been sufficient Peacocks to properly monitor their period of entry into hibernation. This began on 23rd July, the same date as in 2018 and also happened in a rush. The peak number of 13 was reached by 1st August in just one week. But the story didn’t end there one week later by 9th August the total had fallen to just 8.
From that low point numbers slowly built back up, reaching 13 again by 26th September. So, for the first time, I recorded the “two phases” pattern of entering hibernation for the Peacock.
Like the Small Tortoiseshell, the first phase was a sudden rush and the second phase longer and slower. The key difference is that of all the Peacocks hibernated in the first phase, 40% of them then re-emerged to form the group which undertook the second phase hibernation.
Conclusions
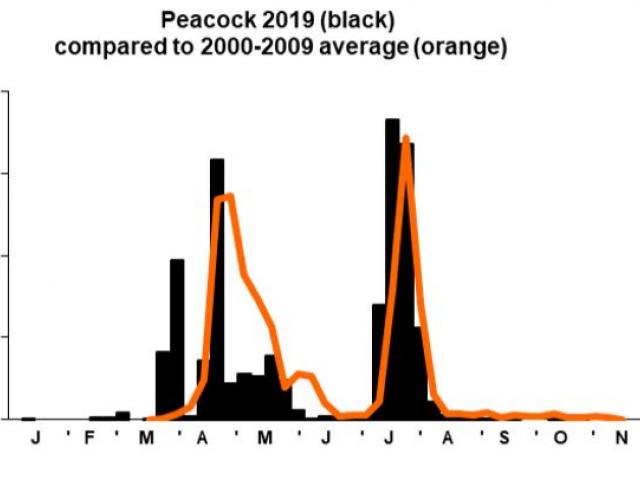
There is not yet any systematic monitoring of hibernating dates at other locations regularly published. However detailed flight records for the Herts & Middx Vice Counties are published in Butterfly Conservations Annual Report for Herts & Middx by Andrew Wood. The charts below show the 2019 flight records and compare these with figures from the 200-2009 decade.
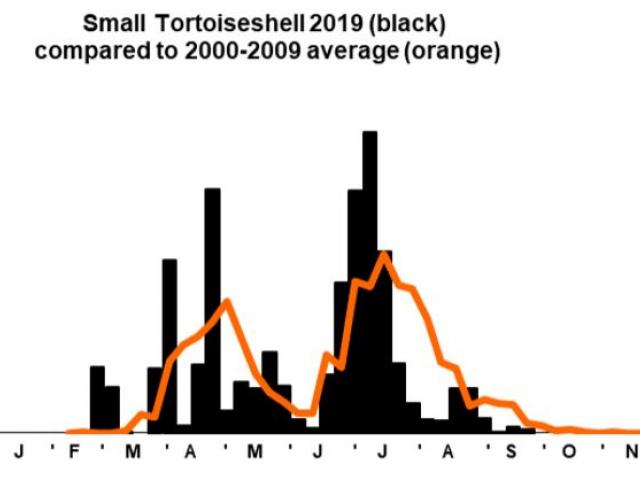
The change for Small Tortoiseshell can be clearly seen, with a considerable reduction in the number of adults observed on the wing during August. This correlates closely with my own observations that hibernation now takes place much earlier than it did a decade ago. Each year most of the second generation has been lost and the reasons for this are unclear.
Malcolm Hull
Butterfly Conservation Herts & Middx Branch
Follow Malcolm on Twitter