
In November 2019 Butterfly Conservation, in partnership with MothsIreland, published the Atlas of Britain and Ireland’s Larger Moths.
A total of 25.6 million records of 893 species from the National Moth Recording Scheme (NMRS) and MothsIreland datasets, spanning the period of 1741-2016 were combined, bringing together 275 years of survey effort by the moth recording community across the UK, Ireland, the Isle of Man and the Channel Islands. We are extremely grateful to the County Moth Recorder network and the moth recording community without whom this book could not have been produced. Here, we outline how the data on distribution, abundance and seasonal changes were analysed and presented in this new publication.
Distribution trends
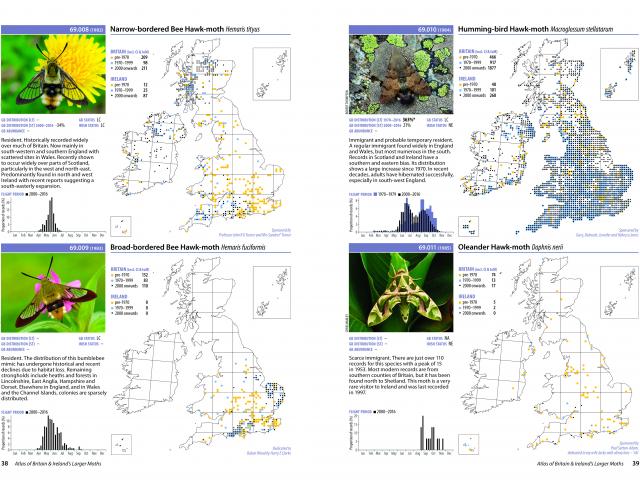
Distribution trends for Great Britain were calculated at 1km x 1km grid square resolution using NMRS records from 1970-2016. NMRS data is generated without a standardised trapping methodology or sampling regime and is therefore subject to distribution bias in time and space. These factors need to be taken into account when estimating changes over time1 and the new occupancy modelling approach2 used to calculate the atlas trends, addressed these concerns3.
To ensure the distribution trends were reliable, data selection was guided by certain criteria. Species were excluded if there were fewer than 100 records over the date range or where the mean number of annual records of a species per decade were less than 20, or through expert judgement4. The final verification was based on expert opinion. This identified that the occupancy modelling approach for Ireland was not appropriate at this time as the data is insufficient to produce reliable trends and therefore only trends for GB were published.
Following these steps, we produced GB long-term distribution trends (1970-2016) for 390 species. Of these 390 species, 121 (31%) exhibited statistically significant declines. Statistically significant increases were shown in 148 (38% of the total) species and a further 121 species (31%) had no significant changes in distribution. The extent of distribution change was variable with 46 of the 121 species (38%) declining by at least 50% and 36 of the 148 (24%) species more than doubling their distribution.
Abundance trends
Abundance trends were calculated from the Rothamsted Insect Survey light-trap network dataset. Rothamsted Research have been running a network of standardised, automated light-traps across Britain, in a variety of habitats since the 1960s. Long-term trends were generated for nocturnal moths from 1970-2016 to match the time period used for the distribution trends. Scientists from the UK Centre for Ecology & Hydrology calculated long-term trends using the Generalized Abundance Index approach which enables seasonal count data from multiple sites to be analysed to compile abundance trends, using all the data collected5. A procedure known as bootstrapping was used to establish the statistical significance of the abundance trends. Robust trends were generated for 397 species, of these, 136 species (34% of the total) decreased. Conversely 45 species (11% of the total) showed statistically significant increases in abundance. Over half of the species (54%) showed no significant changes in abundance. As with the distribution trends, the extent to which species’ abundance changed was variable. Of the 138 declining species, 108 (79%) decreased in abundance by more than 50%. Of the 45 species increasing in abundance 35 (77%) more than doubled in abundance during the 1970-2016 period.
Phenological changes
A preliminary assessment of phenological change for Britain and Ireland’s univoltine larger moths was undertaken. To avoid effects of recording effort bias6, we used the mean flight date approach7 rather than earliest or peak flight dates.
Moth records from the NMRS and MothsIreland datasets (excluding the Channel Islands) were used to calculate mean flight dates for two time periods: 1970-1979 and 2000-2016. Winter-flying species were excluded as they have flight periods which span two calendar years, as were species with fewer than 30 records in one or both time periods; 405 species met the criteria for the analysis.
Mean flight dates were, on average, 4.8 days earlier for 2000-2016 compared with 1970-1979. A total of 329 species (81%) of those assessed were shown to be flying earlier in the year now compared with the 1970s and 76 species (19%) are flying later. There were considerable changes for a minority of species, 12 are now flying at least 14 days earlier in the year compared with the 1970s and 13 are flying at least seven days later than in the 1970s.
Concluding remarks
The atlas provides a timely insight into the status of Britain and Ireland’s larger moths. Rapid changes are occurring, many species are experiencing significant increases in abundance and distribution, while others are declining in one or both measures. A potent cocktail of drivers arising from human activity are likely to be responsible for these patterns of change8. Continued recording and monitoring is vital to contribute to conservation action and keep abreast of the changing fortunes of Britain and Ireland’s larger moths.
Dr Zoë Randle, Senior Surveys Officer
References
1. Isaac, N.J.B. & Pocock, M.J.O. (2015) Bias and information in biological records. Biological Journal of the Linnean Society 115, 522-531. https://doi.org/10.1111/bij.12532
2. Dennis, E.B., Morgan, B.J.T., Freeman, S.N., Ridout, M.S., Brereton, T.M., Fox, R., Powney, G.D. & Roy, D.B. (2017) Efficient occupancy model-fitting for extensive citizen-science data. PLoS One 12, e0174433. https://doi.org/10.1371/journal.pone.0174433
3. MacKenzie, D.I., Nichols, J.D., Lachman, G.B., Droege, S., Royle, J.A. & Langtimm, C.A. (2002) Estimating site occupancy rates when detection probabilities are less than one. Ecology 83, 2248-2255. https://www.jstor.org/stable/4128094
4. Dennis, E.B., Brereton, T.M., Morgan, B.J.T., Fox, R., Shortall, C.R., Prescott, T. & Foster, S. (2019) Trends and indicators for quantifying moth abundance and occupancy in Scotland. Journal of Insect Conservation 23, 369-380. https://doi.org/10.1007/s10841-019-00135-z
5. Dennis, E.B., Morgan, B.J.T., Freeman, S.N., Brereton, T.M. & Roy, D.B. (2016) A generalized abundance index for seasonal invertebrates. Biometrics 72, 1305-1314. https://onlinelibrary.wiley.com/doi/full/10.1111/biom.12506
6. Van Strien, A.J., Plantenga, W.F., Soldaat, L.L., van Swaay, C.A.M. & WallisDeVries, M.F. (2008) Bias in phenology assessments based on first appearance data of butterflies. Oecologia 156, 227-235. https://www.jstor.org/stable/40213243
7. Bishop, T.R., Botham, M.S., Fox, R., Leather, S.R., Chapman, D.S. & Oliver, T.H. (2013) The utility of distribution data in predicting phenology. Methods in Ecology & Evolution 4, 1024-1032. https://doi.org/10.1111/2041-210X.12112
8. Fox, R. (2013) The decline of moths in Great Britain: a review of possible causes. Insect Conservation and Diversity 6, 5-19. https://doi.org/10.1111/j.1752-4598.2012.00186.x